question: how do tracks end up on my yearly top-100 songs playlist?
Last year I dug into the spotifyr package to see if the monthly playlists I curate varied by different track audio features available from the API. This time, I’m back with some more specific questions. Maybe they’ve always done this but, Spotify creates yearly playlists for each user, meant to reflect the user’s top-100 songs. I look forward to getting one each year, but I wish I knew more about how it worked.
Ah yes, a vaguely tantalizing phrase: “the songs you loved most”. I did a little looking around, but haven’t found an official-looking article on how songs get selected for each person. It seems obvious that the number of times one plays a track plays a part, but I’m not sure if there’s anything else to it. I also can’t get that kind of usage data, so I can’t re-engineer their approach (even if I actually knew what it was). But, maybe there’s still something that can be learned with what’s available from the API. In this context, the time spent listening to a given track is a hidden variable (unobserved) that we can’t measure. And we know this hidden variable drives the outcome we’re interested in (is this a top song, yes/no). If we can’t see the real relationship, hopefully we can find characteristics of songs that are positively related to our outcome (in theory, these characteristics would also be positively related to the amount of time spent listening).
a note on my playlist-curation habits
Before we go deeper into what I looked at, I want to say a little more about how I put together playlists on Spotify. I don’t know if this is unusual, but I don’t typically create lists based on moods, genres, or artists (with 1-2 exceptions, e.g. I have one for songs from tv/film soundtracks). Instead, I start a new playlist at the beginning of each month, and add tracks as I encounter them. I don’t restrict myself to only adding a song to only one playlist, so if there’s a track I’m enjoying, it’ll show up across multiple lists. It’s not perfectly precise, but I’m comfortable saying that what’s on my lists is a good proxy for what I enjoyed listening to during a given month.
getting the data
The steps to retrieve the data are similar to where we started in my previous post about spotifyr; we start by pulling down all the tracks from each playlist under my account, and then requesting the audio features for each track.
library(tidyverse)
library(spotifyr)

# fetch the public playlists from my account
my_lists <- get_user_playlists("amateurthoughts")

# pull out every song that ended up in my monthly playlists & the top songs lists
tracks <- my_lists %>%
  filter(str_detect(playlist_name, "Top Songs|'16|'17|'18")) %>%
  get_playlist_tracks()

# then merge in the audio features
tracks <- tracks %>%
  get_track_audio_features() %>%
  right_join(tracks, by = "track_uri") %>%
  as_tibble()
Now we’ll do some cleaning to tag each track that showed up in the year’s “Top Songs” playlist. The tibble for analysis we’re moving towards should be a track*year level dataset (i.e. each track only represented once within each year), containing track features and the dependent variable (whether each track was a “top song”). If a track is used across multiple lists within the same year, we’ll note the number of times it appears, as well as the first month that we observed it.
# clean up the month/year of each playlist
# regular monthly lists look like this: "August '18"
tracks <- tracks %>%
  mutate(nm = playlist_name) %>%
  separate(nm, c("playlist_mon", "playlist_year"), sep = " '") %>%
  mutate(
    playlist_mon  = str_squish(playlist_mon),
    playlist_year = ifelse(
      is.na(playlist_year),
      str_remove_all(playlist_name, "[[:alpha:]]| "),
      str_c("20", playlist_year) %>%
        str_remove_all("[[:alpha:]]| ") %>%
        str_remove("\\(")
    )
  ) %>%
  filter(playlist_year != 2015) # drop a handful from a 2015/2016 combined list

targets <- filter(tracks, str_detect(playlist_name, "Top Songs"))
samples <- anti_join(tracks, targets, by = "playlist_name")

# we want to know whether each track was within the year's top songs list
samples <- targets %>%
  select(playlist_year, track_uri) %>%
  mutate(is_target = 1) %>%
  right_join(samples, by = c("playlist_year", "track_uri")) %>%
  mutate(is_target = replace_na(is_target, 0))

# if a song shows up >1 times within a year, keep the earliest instance
# add a count to show which songs are repeated within a year
samples <- samples %>%
  mutate(playlist_mon = factor(playlist_mon, levels = month.name)) %>%
  arrange(track_uri, playlist_year, playlist_mon) %>%
  add_count(track_uri, playlist_year, name = "num_lists") %>%
  distinct(track_uri, playlist_year, .keep_all = TRUE)

# where are the missing 49 songs?
count(samples, is_target)
## # A tibble: 2 x 2
## is_target n
## <dbl> <int>
## 1 0 833
## 2 1 251Sadly, I wasn’t able to match 49 tracks from the set of “Top Songs” (about 16% of the total number of “Top Songs”), and I’m not sure how to account for each of them. For a handful, it looks as if the track URI recorded in the “Top Songs” list(s) is different than what’s recorded in my monthly playlists. For others, it’s as if the tracks were never added to my monthly playlists. Maybe there’s some contamination with the miscellaneous lists I mentioned in the previous section; 3 of the missing tracks from 2018 were ones that would fit in my “soundtracks” playlist.
In any case, here’s some contextual information about all the tracks/playlists in the collection we’re looking at. I have a “Top Songs” list for 2016, 2017, and 2018, so that means we’re looking at all the tracks from my monthly playlists during these years.
| Year | # Songs, Median | Mean | SD | # Minutes, Median | Mean | SD |
|---|---|---|---|---|---|---|
| 2016 | 24.0 | 24.7 | 5.6 | 62.1 | 60.1 | 13.7 |
| 2017 | 40.5 | 38.3 | 6.4 | 97.7 | 94.0 | 17.8 |
| 2018 | 29.5 | 33.5 | 14.1 | 73.3 | 80.5 | 31.5 |
The samples tibble has 1,084 total observations, representing 1,077 unique tracks (64 have been included on more than one list). Each of my monthly playlists has something like 31 songs on it, lasting for about 78 minutes, although it looks like my habits differed a bit over the 3 years.
Next, I have an overview of the audio features from the API. Most of the features are numeric variables. A few of these are probabilities that a song contains a certain quality. For example, one represents the estimate of whether or not a song is being performed live (it seems like this was done based on whether sounds from an audience were detected in the recording). Other features are nominal, non-numeric data that describe the track, such as the song’s musical key or time signature.
| Type | Feature | Description |
|---|---|---|
| Numeric | acousticness | Likelihood that the song features acoustic instruments |
| danceability | Strength and regularity of the beat | |
| duration_ms | Duration of the song (in milliseconds) | |
| energy | How fast and noisy the song sounds | |
| instrumentalness | Likelihood that the song is an instrumental (based on presence/absence of vocals) | |
| liveness | Likelihood that the song is being performed live | |
| loudness | The average volume of a song | |
| tempo | The song’s tempo | |
| valence | How cheerful the song sounds | |
| Nominal | key | The song’s musical key |
| mode | Whether the song’s key is major or minor | |
| time_signature | The song’s estimated time signature (meter) |
some exploratory analysis
Okay, now that we know what we’re working with, we can try to move forward to answering my question. Ultimately, I’d like to build a model that can help tell me whether one of the tracks in a playlist of mine will end up on my yearly list, so I’ll set up training/testing datasets for exploration and evaluation. I’ve been trying to learn more about the tidymodels family of packages, and I’ve really appreciated how easy it is to organize this part of the workflow with the rsample package. We’ll use it to chop up our tracks below, starting with initial_split() to generate training/test sets. The initial_split() function creates an rsplit object, which organizes our tracks into different samples/groups. In this case, we’ve randomly allocated 75% of the tracks to the training set, and 25% for testing. The training() and testing() functions are helpers that enable us to easily extract our groups, so we can work on them. In the figures below, we’ll just be using the training data to explore variables of interest.
library(tidymodels)

set.seed(20190914)

ts_split <- initial_split(samples, prop = .75, strata = "playlist_year")
ts_train <- training(ts_split)
ts_test  <- testing(ts_split)
Now comes the disappointing thing I can share with you: I’m not sure if many of the audio features are specifically related to inclusion on my “Top Songs” lists. Before building any models, I started by plotting each of the numeric features, and examining cross-tabulations between the “Top Songs” dependent variable and the nominal features. I’ll show you a plot of the numeric features first to illustrate the problem I encountered. Can you spot the issue? These are density plots for each of the features, with the distributions of tracks that were “top songs” compared to those that weren’t. The shape of these densities show us the most likely values of each feature; the closer a value on the x-axis is to one of the “peaks” of the plot, the more frequently that value is observed in the data.
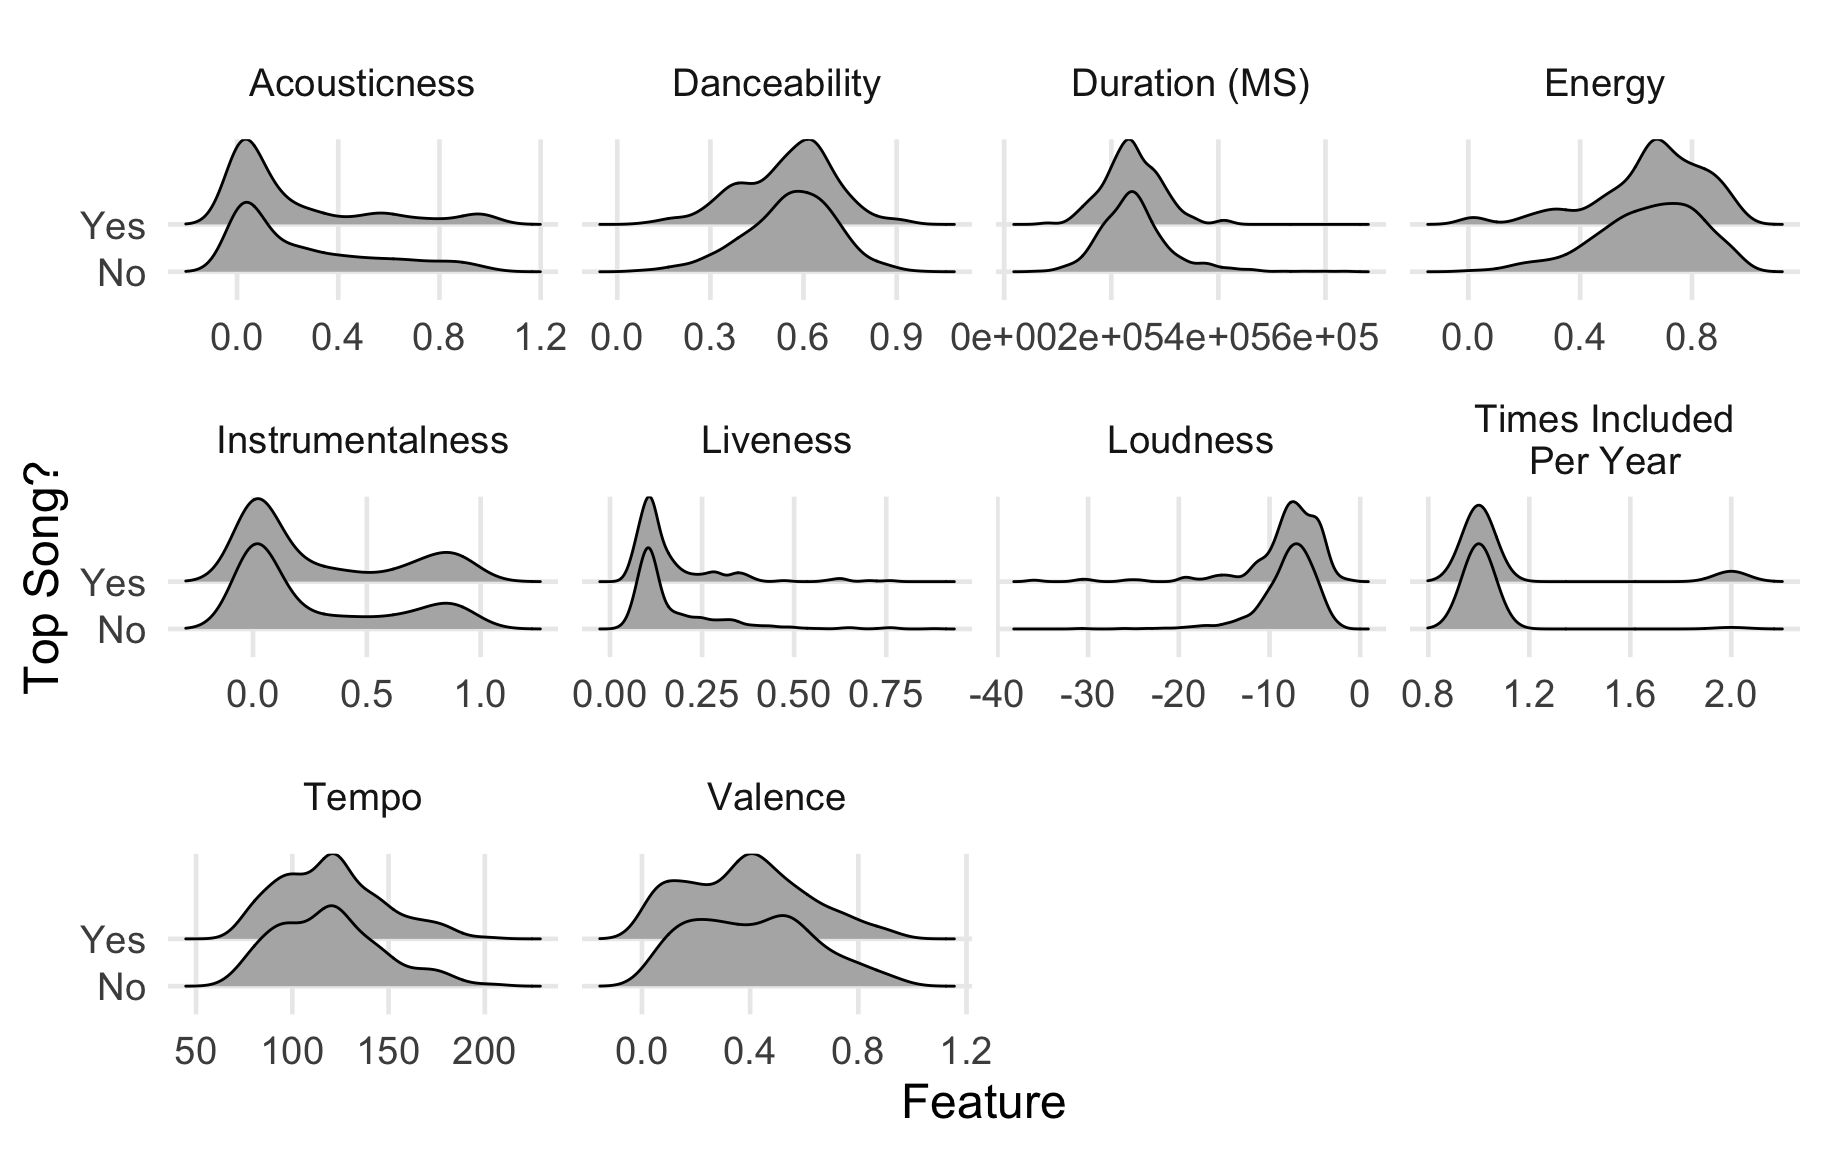
So, the problem… If you look at each pair of density plots, they each look really similar to each other. They’re not identical, but the modal values for each feature seem really close. What does this mean? Well, it seems that my “top songs” are very representative of the other songs in my playlists that don’t end up in one of the “top songs” lists. At least with this set of features, I don’t think any model I could build would really do much to discriminate between potential “top songs” from regular songs.
But, maybe there’s something hiding in some of the nominal variables? If you wanted a variable that could easily signify a song’s mood or feel, you’d want to know its musical key. At this point, I’m feeling the limits of my theoretical understandings. There’s a lot of stuff I wish I knew concerning progressions of chords, keys, and other compositional aspects in how they relate to popular music. It’d probably be useful to bring to bear on this little project, because what I’m about to show you left me more encouraged than the previous figures.
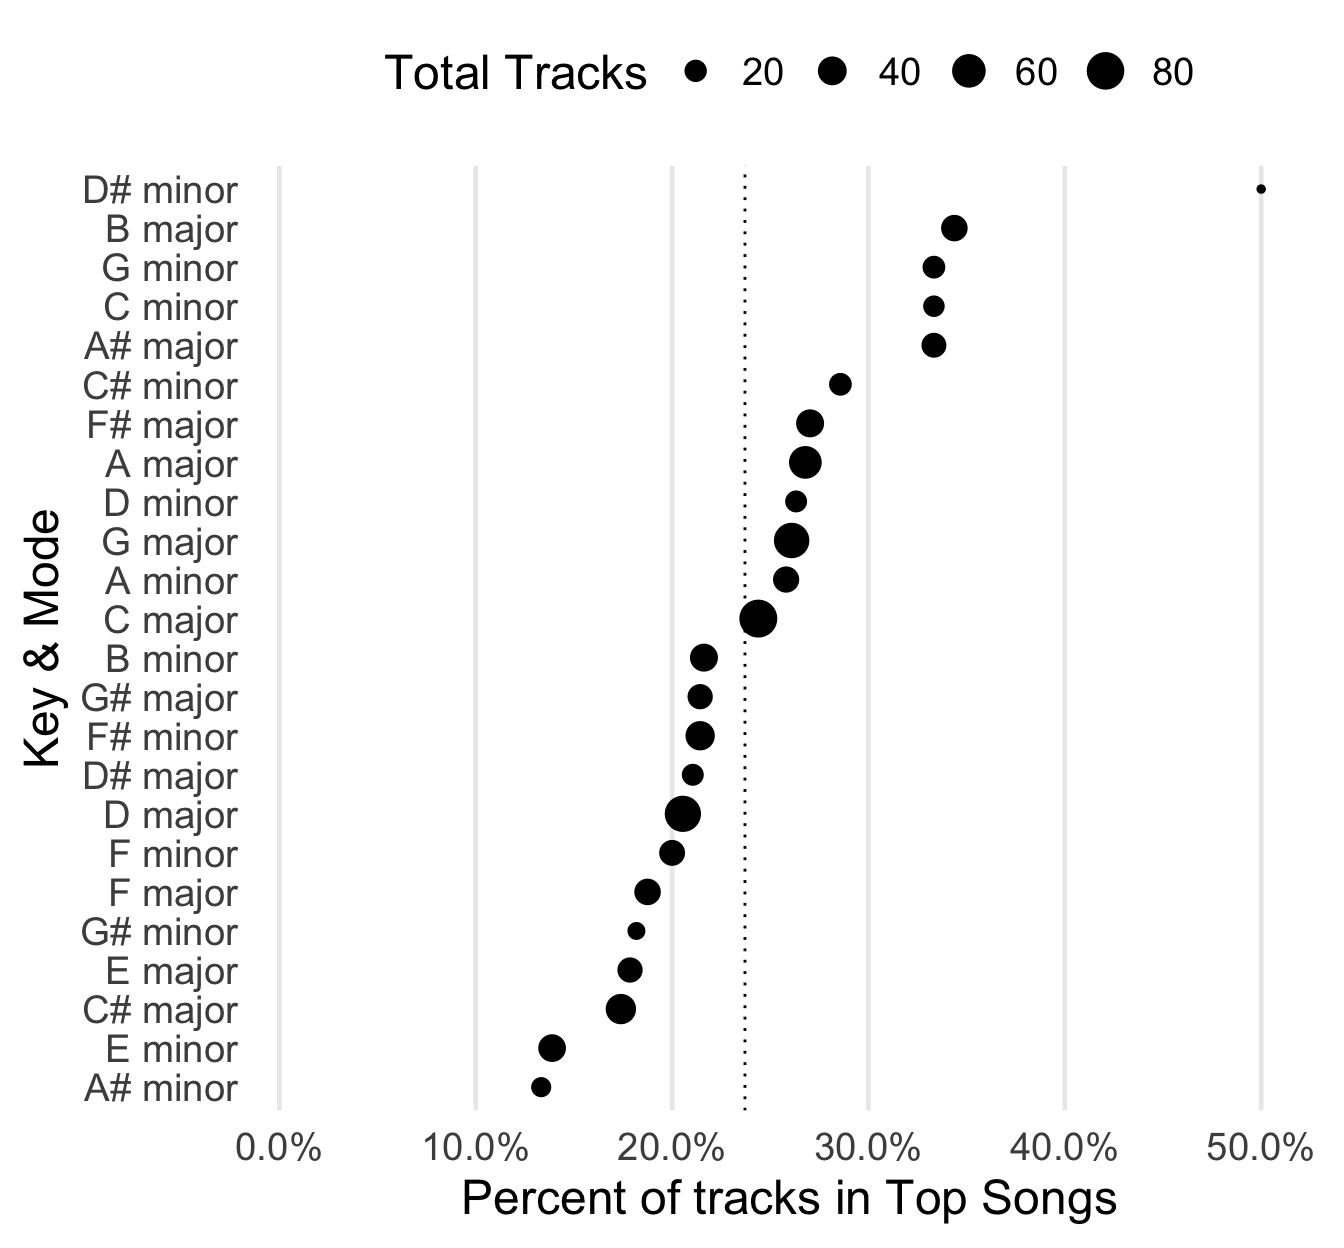
Quick explanation of what’s going on in this plot. Along the y-axis we have each major/minor key, and along the x-axis we have the percent of tracks in a given key/mode that ended up in one of my “top songs” playlists. Each dot/point is sized by the total number of tracks in each key/mode. Bigger points mean the key/mode is more common in the collection of tracks. Lastly, I’ve included a dotted reference line (at 23.7%); this represents the overall proportion of tracks that ended up in the “top songs” playlists.
So, here’s the takeaway: points past the dotted line seem to be beating what would be expected by a random track. B-Major is about where I expected, as far as its rank. It has a bunch of my recent favorites, but it’s also home to all kinds of earworms (e.g. Lady Gaga’s “Poker Face” and Neil Diamond’s “Sweet Caroline”). I can’t really explain what’s going on with D# minor up there (the true unicorns, rare & good?), but Bogan Via’s “Kanye” and Rogue Wave’s “Look at Me” really are some of my favorite finds. RIP to A# minor, I looked at all the tracks I had from that set, and I barely remember any of them.
The last thing we’ll look at is whether there are any seasonal patterns in the tracks that ended up in my “top songs”. In my previous post, I at least observed some variation in the different audio features across the different months I was curating playlists. I don’t know if there are really points in which I’m listening to more/less music across the year, or if I have a rhythm to when I’m actively digging up new songs, but maybe I just haven’t been paying attention. Or, maybe I’m revisiting certain playlists more often than others? But, as I mentioned early on, I don’t think this is characteristic of my habits.
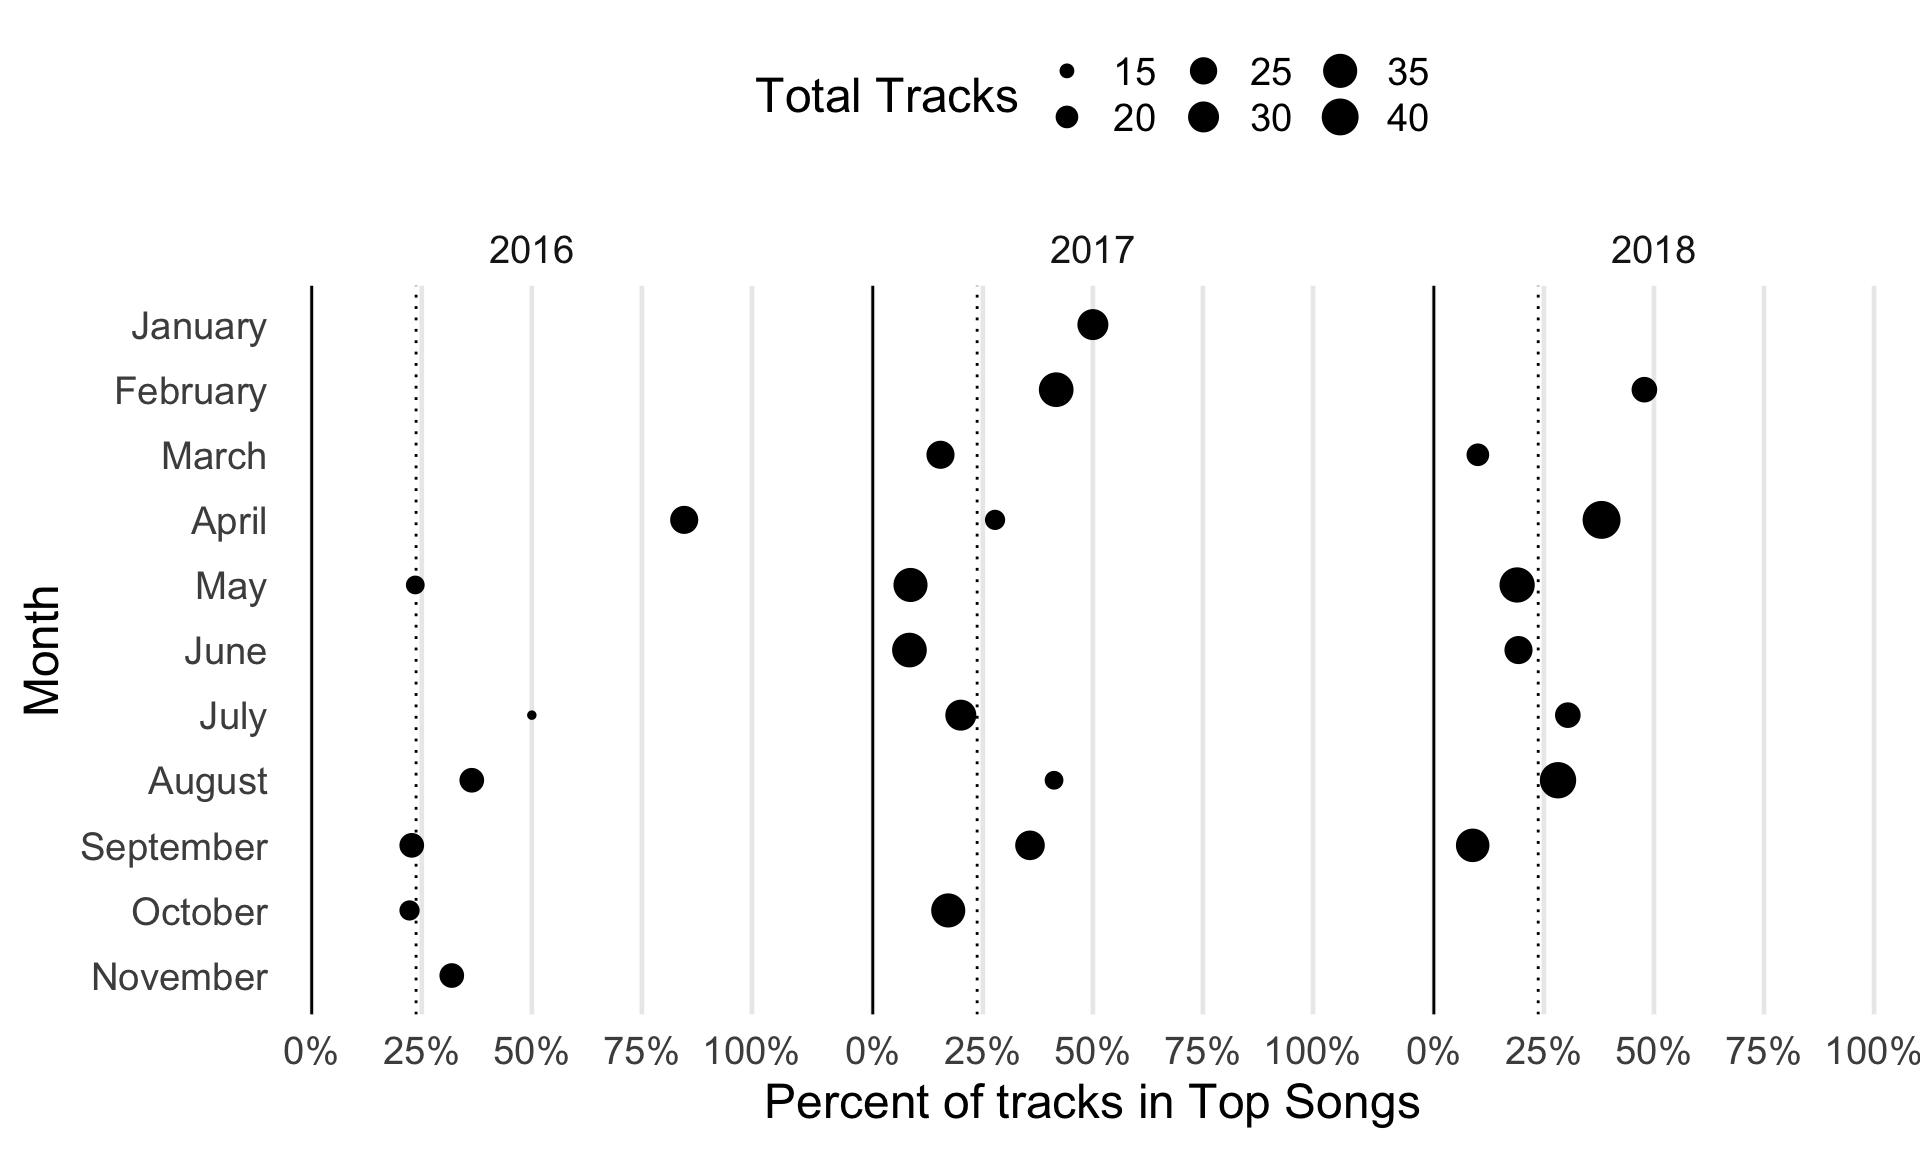
This figure is laid out similarly to the last one, but I have a few notes:
- I didn’t start making monthly playlists until around April 2016, which is why we’re missing some points.
- It looks like none of the songs I have for January, October, or November 2018 ended up in my “top songs”, which is why we’re missing points there too.
- December never shows up in my “top songs”! This is probably when the program that builds the playlist is run, so I guess any late discoveries are just left out. Maybe some of them survive to live on in my January playlists for the next year?
- Aside from these items, it looks like there’s something to late spring, late summer, and midwinter. But, the relationship doesn’t seem super consistent across each year.
can we build a model to predict my “top songs” for 2019?
Maybe! I’m disappointed that none of the continuous/numeric features look promising. At the same time, there might be enough to make decent predictions with my seasonal patterns and the key/mode information. We have a few months until December, so maybe we’ll have a real test using fresher data from 2019. All these little findings might only apply to my personal habits, but I’m still curious if they’d be helpful for predicting someone else’s “top songs” list, or if they’re related to other kinds of user behavior.
As a next step, I’ll use a supervised learning approach to build some classifiers using functions from recipes and parsnip (both found in tidymodels), using the training/test data we created earlier. Afterwards, I’ll use a few different metrics from yardstick to see how well they perform. However, this post ended up being a lot longer than I expected, so I’m going to break out the actual model building and assessment into a second post. You should be able to find it here, when it’s up.